之前在研究小伙伴遗留代码的时候,发现了PerformanceObserver这玩意,不看不知道,越看越有意思。
其实这个 API 出了挺久了,机缘巧合下一直没有接触到,直到最近开始深入研究前端性能情况。
# PerformanceObserver
其实单看PerformanceObserver的官方描述 (opens new window),好像没什么特别的:
PerformanceObserver()构造函数使用给定的观察者callback生成一个新的PerformanceObserver对象。当通过observe()方法注册的条目类型的性能条目事件被记录下来时,调用该观察者回调。
乍一看,好像跟我们网页开发和性能数据没什么太大关系。
# 常见的性能指标数据获取
在很早的时候,前端开发的性能数据很多都是从Performance (opens new window)里获取:
Performance接口可以获取到当前页面中与性能相关的信息。它是 High Resolution Time API 的一部分,同时也融合了 Performance Timeline API、Navigation Timing API、User Timing API 和 Resource Timing API。
提到页面加载耗时,还是得祭出这张熟悉的图(来自PerformanceNavigationTiming API (opens new window)):

上述图中的数据都可以从window.performance中获取到。
一般来说,我们可以在页面加载的某个结点(比如onload)的时候获取,并进行上报。
但这仅包含页面打开过程的性能数据,而近年来除了网页打开,网页使用过程中的用户体验也逐渐开始被重视了起来。
2024 年 3 月起,INP (Interaction to Next Paint) 将替代 First Input Delay (FID) 加入 Largest Contentful Paint (LCP) 和 Cumulative Layout Shift (CLS),作为三项稳定的核心网页指标。尽管第一印象很重要,但首次互动(FID)不一定代表网页生命周期内的所有互动(INP)。
这意味着我们还需要关注整个网页生命周期内的用户体验,PerformanceObserver的设计正是为了提供用户体验相关性能数据,它鼓励开发人员尽可能使用。
# PerformanceObserver 对象
[PerformanceObserver]{https://developer.mozilla.org/zh-CN/docs/Web/API/PerformanceObserver} 对象为性能监测对象,用于监测性能度量事件,在浏览器的性能时间轴记录新的 performance entry 的时候将会被通知。
研究过前端性能的人,或许还有些对PerformanceObserver不大熟悉(比如我),但是所有大概都知道 Chrome 浏览器的 Performance 性能时间轴:
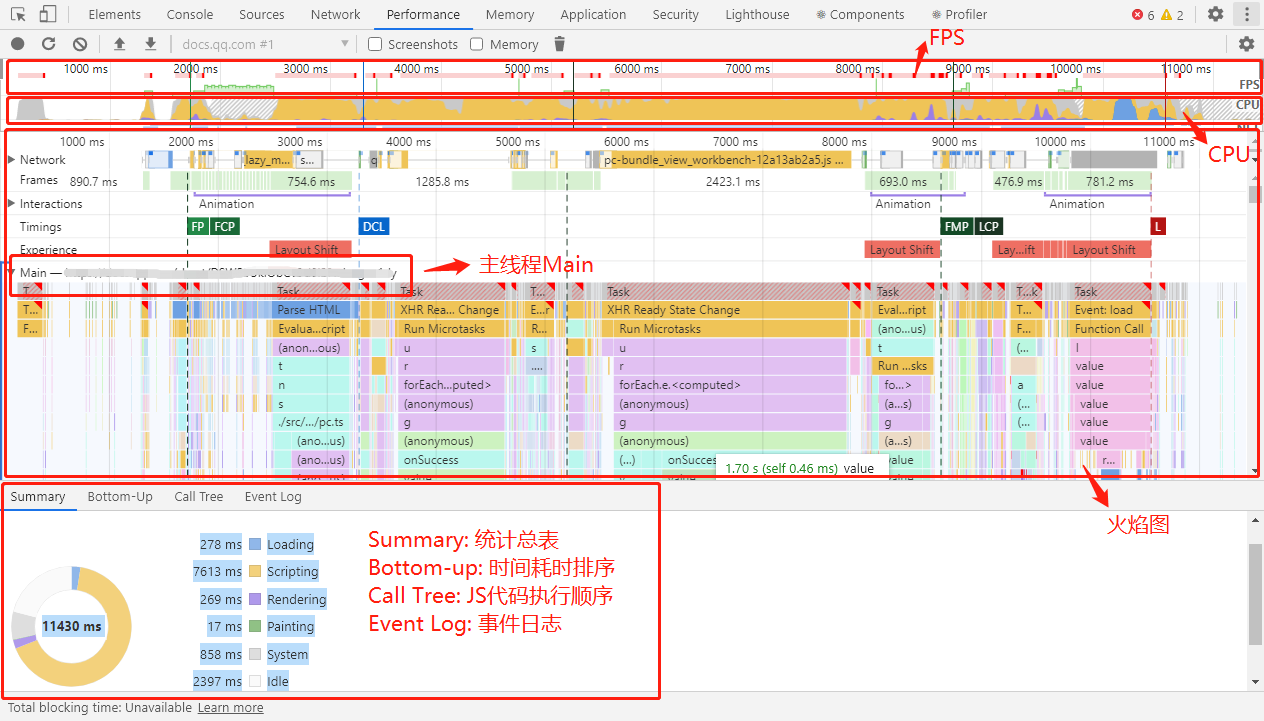
作为 Performance 面板的老用户,我们常常会从时间轴上捞取出存在性能问题的操作,然后细细分析和研究对应的代码执行情况。而这个时间轴上记录下 performance entry 时,我们可以当通过observe()方法获取到对应的内容和数据。
前面提到,如果我们需要关注网页在整个生命周期中的性能情况,意味着需要定期轮询、埋点等方式做上报。通过使用PerformanceObserver接口,我们可以:
- 避免轮询时间线来检测新指标
- 避免新增删除重复数据逻辑来识别新指标
- 避免与其他可能想要操纵缓冲区的消费者的竞争条件
# PageSpeed Insights (PSI) 前端性能指标
之前给大家讲过前端性能数据指标体系,我们能看到核心网页指标包括 FID、LCP 和 CLS,他们都可以从使用PerformanceObserver直接拿到:
// FID
new PerformanceObserver((entryList) => {
  for (const entry of entryList.getEntries()) {
    const delay = entry.processingStart - entry.startTime;
    console.log("FID candidate:", delay, entry);
  }
}).observe({ type: "first-input", buffered: true });
// LCP
new PerformanceObserver((entryList) => {
  for (const entry of entryList.getEntries()) {
    console.log("LCP candidate:", entry.startTime, entry);
  }
}).observe({ type: "largest-contentful-paint", buffered: true });
此外,web-vitals JavaScript 库 (opens new window)可用来测量真实用户的所有 Web Vitals 指标,其方式准确匹配 Chrome 的测量方式。他提供了 PSI 中的各种指标数据:CLS、FID、LCP、INP、FCP、TTFB,如果你仔细研究它的实现,便是使用PerformanceObserver的能力。
比如,INP 需要监控整个网页生命周期中的交互体验,我们可以看到其实现 (opens new window)基于PerformanceEventTiming的监测实现:
new PerformanceObserver((list) => {
  list.getEntries().forEach((entry) => {
    // Full duration
    const duration = entry.duration;

    // Input delay (before processing event)
    const delay = entry.processingStart - entry.startTime;

    // Synchronous event processing time
    // (between start and end dispatch)
    const eventHandlerTime = entry.processingEnd - entry.processingStart;
    console.log(`Total duration: ${duration}`);
    console.log(`Event delay: ${delay}`);
    console.log(`Event handler duration: ${eventHandlerTime}`);
  });
}).observe({ type: "event" });
而Event Timing API中包括的用户交互事件几乎是很全的,但该方式可用于检测用户交互的流畅性,并不能作为出现卡顿时的定位方案。具体卡顿的定位,可参考《前端性能卡顿的监控和定位方案》一文。
# resource observe 获取资源加载时机
在《前端性能卡顿的监控和定位方案》这篇文章中,我们还发现一个有意思的使用方式:
new PerformanceObserver((resource) => {
  const entries = resource.getEntries();

  entries.forEach((entry: PerformanceResourceTiming) => {
    // 获取 JavaScript 资源
    if (entry.initiatorType !== "script") return;
    const startTime = new Date().getTime();

    window.requestAnimationFrame(() => {
      // JavaScript 资源加载完成
      const endTime = new Date().getTime();
    });
  });
}).observe({ entryTypes: ["resource"] });
除了使用performanceObserver监测resource资源获取性能数据,我们还可以在回调触发时开始计数,以此计算该 JavaScript 资源加载耗时,从而考虑是否需要对资源进行更合理的分包。
# 自定义性能指标
配合PerformanceObserver,我们还可以使用User Timing API (opens new window) 进行自定义打点:
// Record the time immediately before running a task.
performance.mark("myTask:start");
await doMyTask();
// Record the time immediately after running a task.
performance.mark("myTask:end");

// Measure the delta between the start and end of the task
performance.measure("myTask", "myTask:start", "myTask:end");
然后使用PerformanceObserver获取相关指标数据:
// 有兼容性,需要处理异常
try {
  const po = new PerformanceObserver((list) => {
    for (const entry of list.getEntries()) {
      console.log(entry.toJSON());
    }
  });
  // 监测 measure entry
  po.observe({ type: "measure", buffered: true });
} catch (e) {}
更多的使用方式,可以参考自定义指标 (opens new window)一文。
# 参考
- User Timing Level 3 (opens new window)
- Performance Timeline (opens new window)
- PerformanceEventTiming (opens new window)
- Performance: measure() method (opens new window)
- PerformanceEntry.entryType (opens new window)
- Timeline event reference (opens new window)
# 结束语
由于PerformanceObserver 对象与浏览器的性能时间轴紧紧相关,基于此我们可以做很多性能监测的事情。
如果想偷懒,使用 web-vitals JavaScript 库并对 PSI 定义的核心指标进行上报,我们就能大概掌握了网页的核心性能指标数据,并以此进行分析和优化。
前端性能在前端领域中,也算是个亘古不变的难题,每次研究总能学到新的知识,这也是挺有趣的一件事呢。